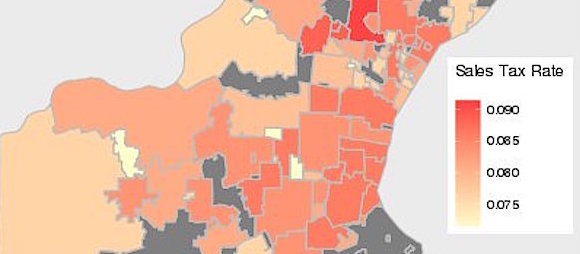
Mapping St. Louis (@mappingSTL on Twitter) made a map of St. Louis County showing sales tax rates for each county municipality in 2014.
The rates in Brentwood, Richmond Heights and Maplewood of 0.08613 are tied for fifth highest with 15 other municipalities including Clayton, Rock Hill, Webster Groves, and University City.
Although the Better Together data does not include small taxing districts that many municipalities set up for developments.
The map was made from information attributed to St. Louis Better Together.
Also from the St. Louis Better Together tax information:
Brentwood
- Total taxes: $20,721,000
- Total debt: $7,970,000
- Outstanding TIF debt: $34,065,000
- Population: 8,035
Maplewood
- Total taxes: $11,438,791
- Total debt: $3,820,559
- Outstanding TIF debt: $10,744,527
- Population: 8,017
Richmond Heights
- Total taxes: $14,842,319
- Total debt: $14,610,000
- Outstanding TIF debt: $14,295,000
- Population: 8,566
STL County sale tax rate by muni via @BTstl . Top 5 – Berkeley, Edmundson, St. Ann, Woodson Terrace, and Brentwood. https://t.co/ukWq6mLeVM pic.twitter.com/Yt37q03k16
— Mapping St. Louis (@mappingSTL) September 23, 2017


I have a hard time believing that the newest taxing information they could use was from 2014. This is almost 2018 and I know that all of them are at least 1% higher now.
Sales tax rate doesn’t bother me as much as the real estate tax on my house.
Thanks Doug. Does Maplewood, Brentwood or Richmond Heights have any small taxing districts referenced? Just curious.
Not sure, but possibly the Galleria in Richmond Heights, and the Promenade and Brentwood Square.